玩转Prometheus(1)–第1个例子
版权声明 本站原创文章 由 萌叔 发表
转载请注明 萌叔 | https://vearne.cc
前言
在工作的这几年里,接触不少监控系统, Nagios、Cacti、Zabbix、Open-falcon, 今年开始在新公司使用Prometheus, 网上有文章把Prometheus 称为新一代的监控系统,我一直很好奇,它的新体现在哪儿,相比与传统的监控系统,它有什么优势。
在经过一段时间的使用以后,我觉得我有了一些体会,下面我们通过1个例子来感受一下。
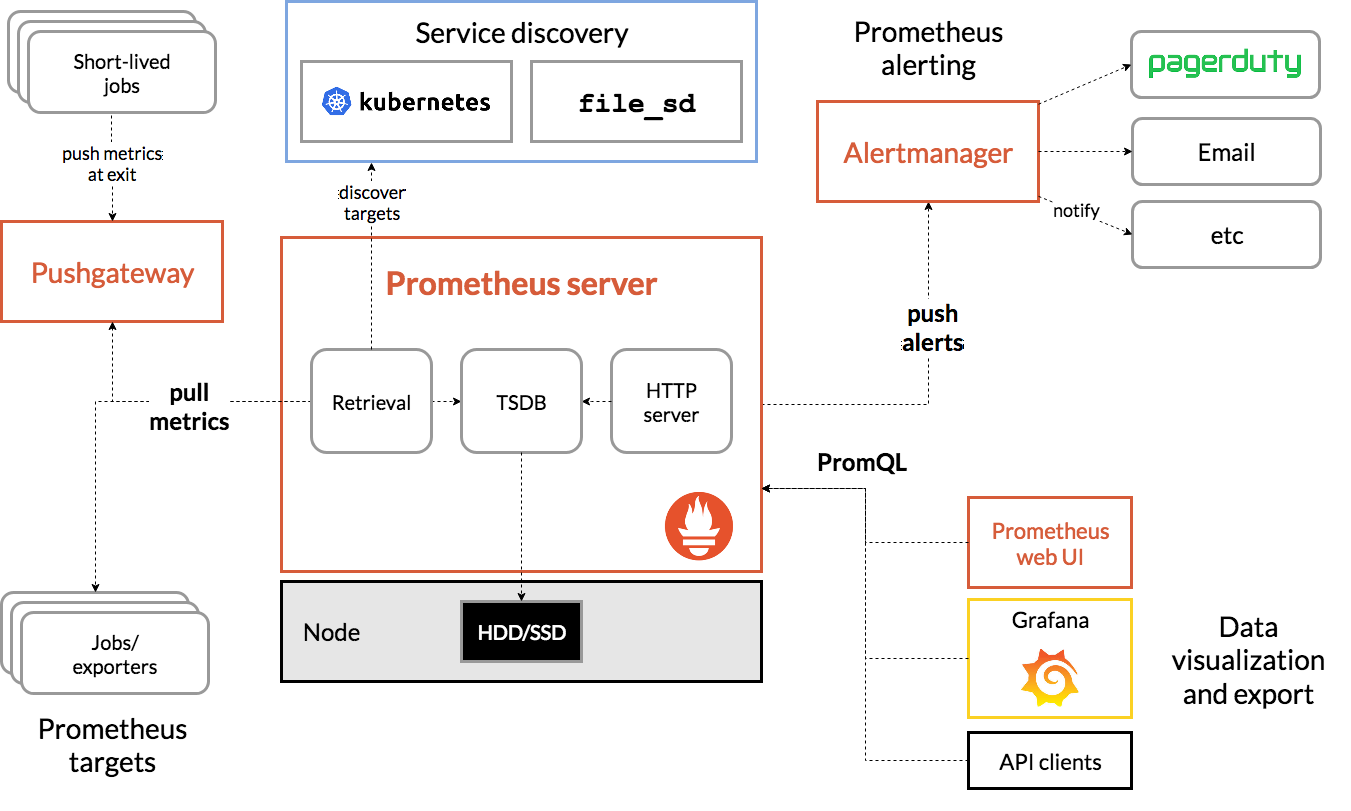
Prometheus的体系架构图
应用场景
从目前各个公司的实践情况来看,Prometheus主要用于应用服务的监控,尤其是基于docker的应用服务;而像主机的运行情况(cpu使用率、内存使用率),网络设备的监控等,依然由传统的监控系统来做。
1. 模拟的应用服务
假定我们有一个web服务叫fake_service
fake_server.go
package main

import (
    "github.com/prometheus/client_golang/prometheus"
    "github.com/prometheus/client_golang/prometheus/promhttp"
    "gopkg.in/gin-gonic/gin.v1"
    "strconv"
    "strings"
    "time"
)

var (
    //HTTPReqDuration metric:http_request_duration_seconds
    HTTPReqDuration *prometheus.HistogramVec
    //HTTPReqTotal metric:http_request_total
    HTTPReqTotal *prometheus.CounterVec
)

func init() {
    // 监控接口请求耗时
    // HistogramVec 是一组Histogram
    HTTPReqDuration = prometheus.NewHistogramVec(prometheus.HistogramOpts{
        Name:    "http_request_duration_seconds",
        Help:    "The HTTP request latencies in seconds.",
        Buckets: nil,
    }, []string{"method", "path"})
    // 这里的"method"、"path" 都是label
    // 监控接口请求次数
    // HistogramVec 是一组Histogram
    HTTPReqTotal = prometheus.NewCounterVec(prometheus.CounterOpts{
        Name: "http_requests_total",
        Help: "Total number of HTTP requests made.",
    }, []string{"method", "path", "status"})
    // 这里的"method"、"path"、"status" 都是label
    prometheus.MustRegister(
        HTTPReqDuration,
        HTTPReqTotal,
    )
}

// /api/epgInfo/1371648200  -> /api/epgInfo
func parsePath(path string) string {
    itemList := strings.Split(path, "/")
    if len(path) >= 4 {
        return strings.Join(itemList[0:3], "/")
    }
    return path
}

//Metric metric middleware
func Metric() gin.HandlerFunc {
    return func(c *gin.Context) {
        tBegin := time.Now()
        c.Next()

        duration := float64(time.Since(tBegin)) / float64(time.Second)

        path := parsePath(c.Request.URL.Path)

        // 请求数加1
        HTTPReqTotal.With(prometheus.Labels{
            "method": c.Request.Method,
            "path":   path,
            "status": strconv.Itoa(c.Writer.Status()),
        }).Inc()

        //  记录本次请求处理时间
        HTTPReqDuration.With(prometheus.Labels{
            "method": c.Request.Method,
            "path":   path,
        }).Observe(duration)
    }
}

func DealAPI1(c *gin.Context) {
    time.Sleep(time.Microsecond * 10)
    c.Writer.Write([]byte("/api/api1"))
}

func DealAPI2(c *gin.Context) {
    time.Sleep(time.Microsecond * 20)
    c.Writer.Write([]byte("/api/api2"))
}

func main() {
    router := gin.Default()
    g := router.Group("/api")
    g.Use(Metric())

    g.GET("api1", DealAPI1)
    g.GET("api2", DealAPI2)

    // 暴露给Prometheus
    router.GET("/metrics", gin.WrapH(promhttp.Handler()))
    router.Run(":28181")
}
使用fake_client.go模拟真实用户的请求
完整代码
用法:
./fake_client --host 192.168.100.201
现在我们服务对外提供了2个接口/api/api1和/api/api2, 并且通过
/metrics将指标信息暴露给外部。
2. 在Prometrics中进行配置
假定我们的服务部署在2台机器上(dev1、dev3)
...
scrape_configs:
  - job_name: 'fake_service'
    static_configs:
      - targets: ['dev1:28181', 'dev3:28181']
        labels:
          project: "fake_service"
          environment: "prod"
targets 除了直接将服务地址写死在文件中,也可以使用
dns_sd_config 通过DNS解析
consul_sd_configs 通过consul自动加载
详见参考资料1
labels中是自定义的标签,每分钟采集1次数据,数据默认存储1周
好,现在让我们看看metrics接口都吐出什么数据
curl http://dev3:28181/metrics
我们能够看到类似下面的数据
http_requests_total{method="GET",path="/api/api1",status="200"} 763338
http_requests_total{method="GET",path="/api/api2",status="200"} 1.52676e+06
http_request_duration_seconds_bucket{method="GET",path="/api/api1",le="0.005"} 763106
http_request_duration_seconds_bucket{method="GET",path="/api/api1",le="0.01"} 763261
http_request_duration_seconds_bucket{method="GET",path="/api/api1",le="0.025"} 763337
http_request_duration_seconds_bucket{method="GET",path="/api/api1",le="0.05"} 763338
然后当我在Prometheus中执行query="http_requests_total"时
图表产生了4条曲线(4个独立时序),见下图
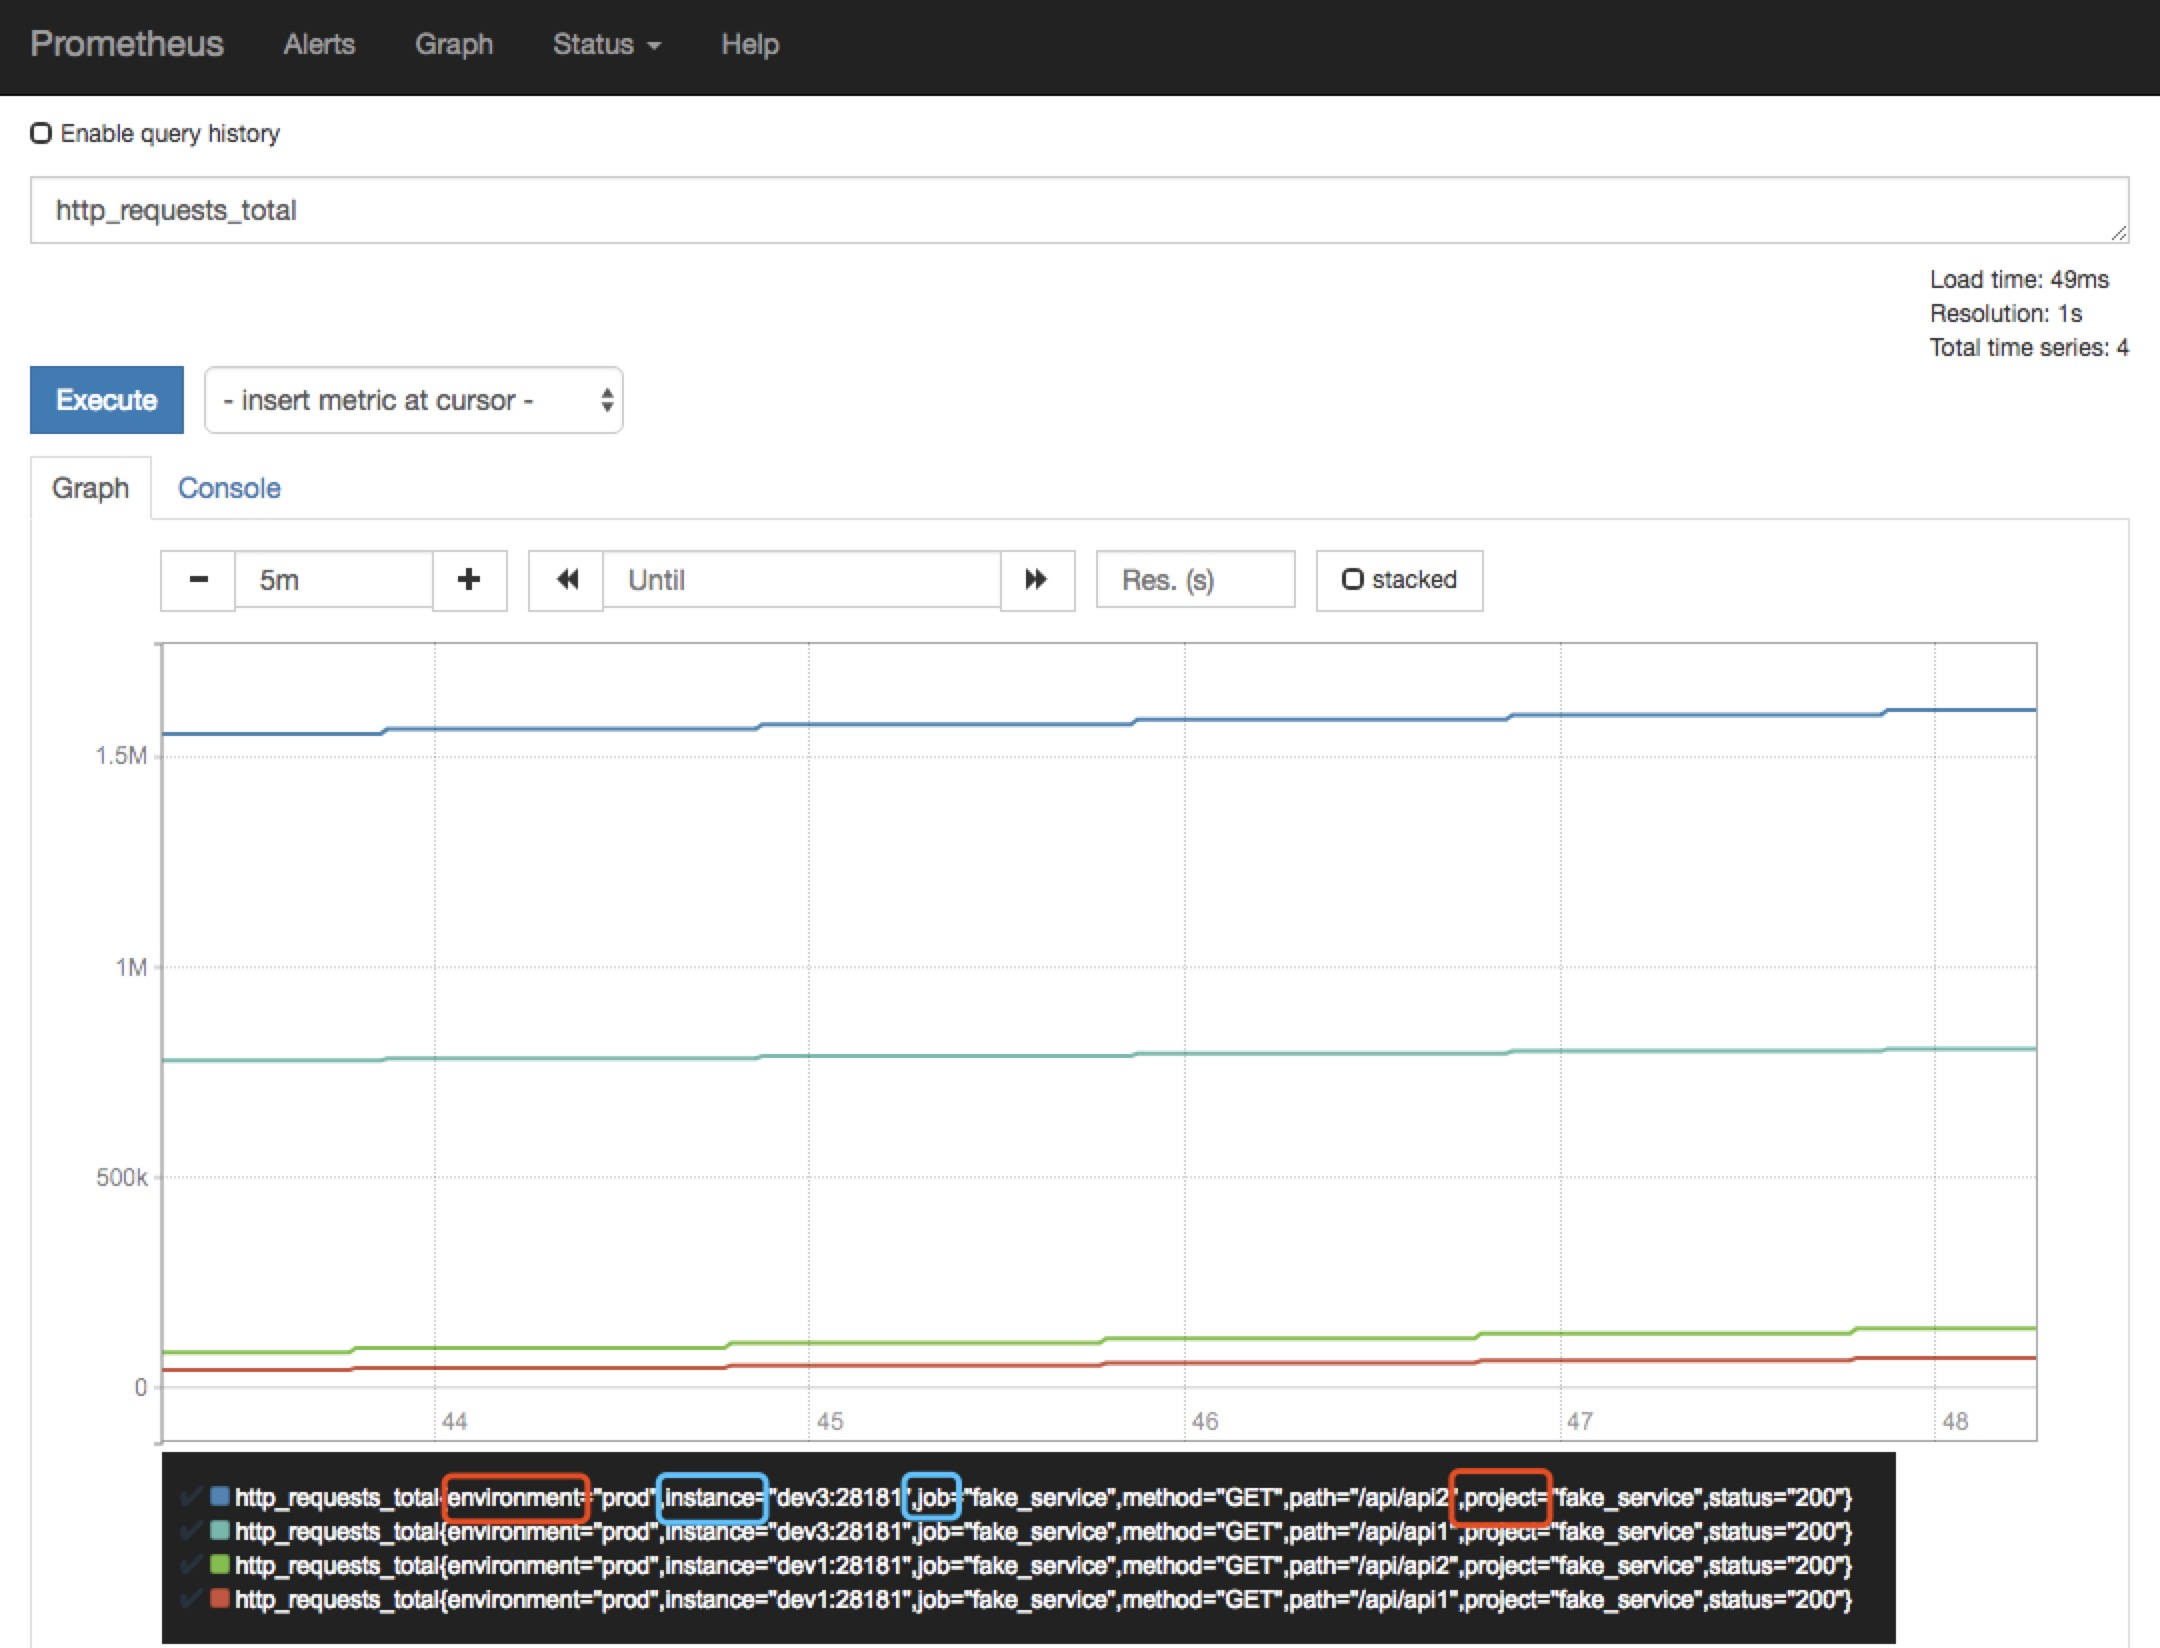
http_requests_total{environment="prod",instance="dev1:28181",job="fake_service",method="GET",path="/api/api1",project="fake_service",status="200"}
http_requests_total{environment="prod",instance="dev1:28181",job="fake_service",method="GET",path="/api/api2",project="fake_service",status="200"}
http_requests_total{environment="prod",instance="dev3:28181",job="fake_service",method="GET",path="/api/api1",project="fake_service",status="200"}
http_requests_total{environment="prod",instance="dev3:28181",job="fake_service",method="GET",path="/api/api2",project="fake_service",status="200"}
http_requests_total 是metric, environment、instance、job、method、path、project、status都是标签。instance和job是由Prometheus自动添加的(上图蓝色),project和environment 是由我们在配置文件中添加的(上图红色)。
通过上面的示例,我们能够知道
1)在Prometheus中,metric + 1组labels可以构成一个独立的时序
2)1条PromQL查询语句,可以产生命中多个时序,进而在图表中产生多条曲线。
3. 在Grafana中配置
在实际情况下,Prometheus通常和Grafana配置使用,下面展示几个常用的配置
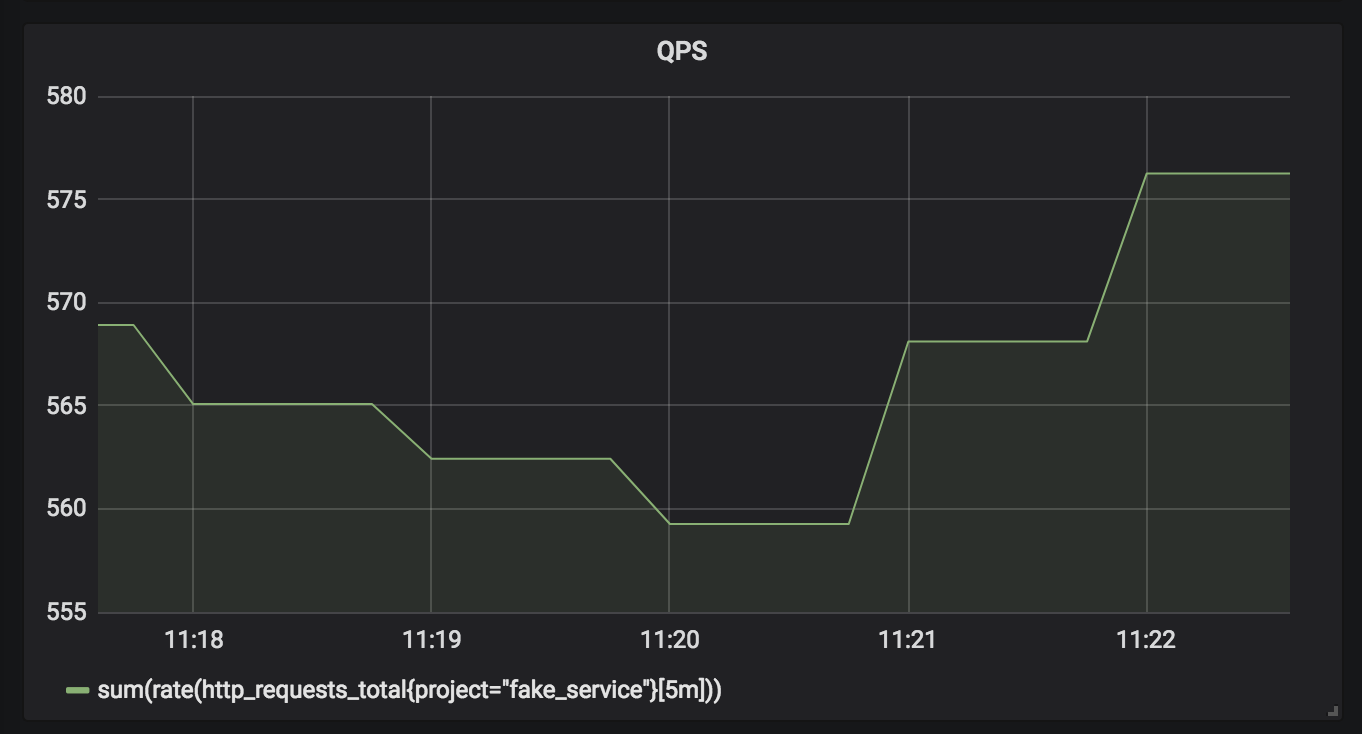
3.1 服务总的QPS
Query:
sum(rate(http_requests_total{project="fake_service"}[5m]))
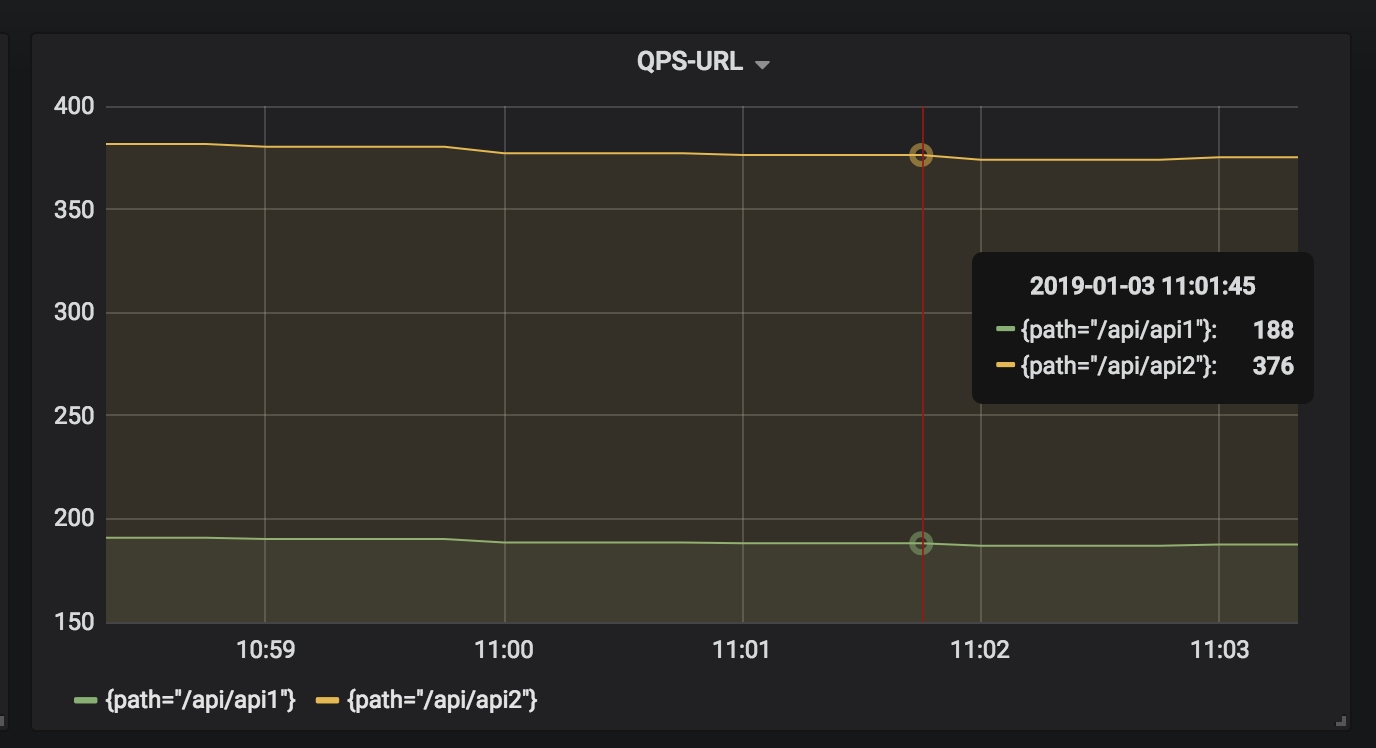
3.2 分接口-统计QPS
Query:
sum(rate(http_requests_total{project="fake_service"}[5m])) by (path)
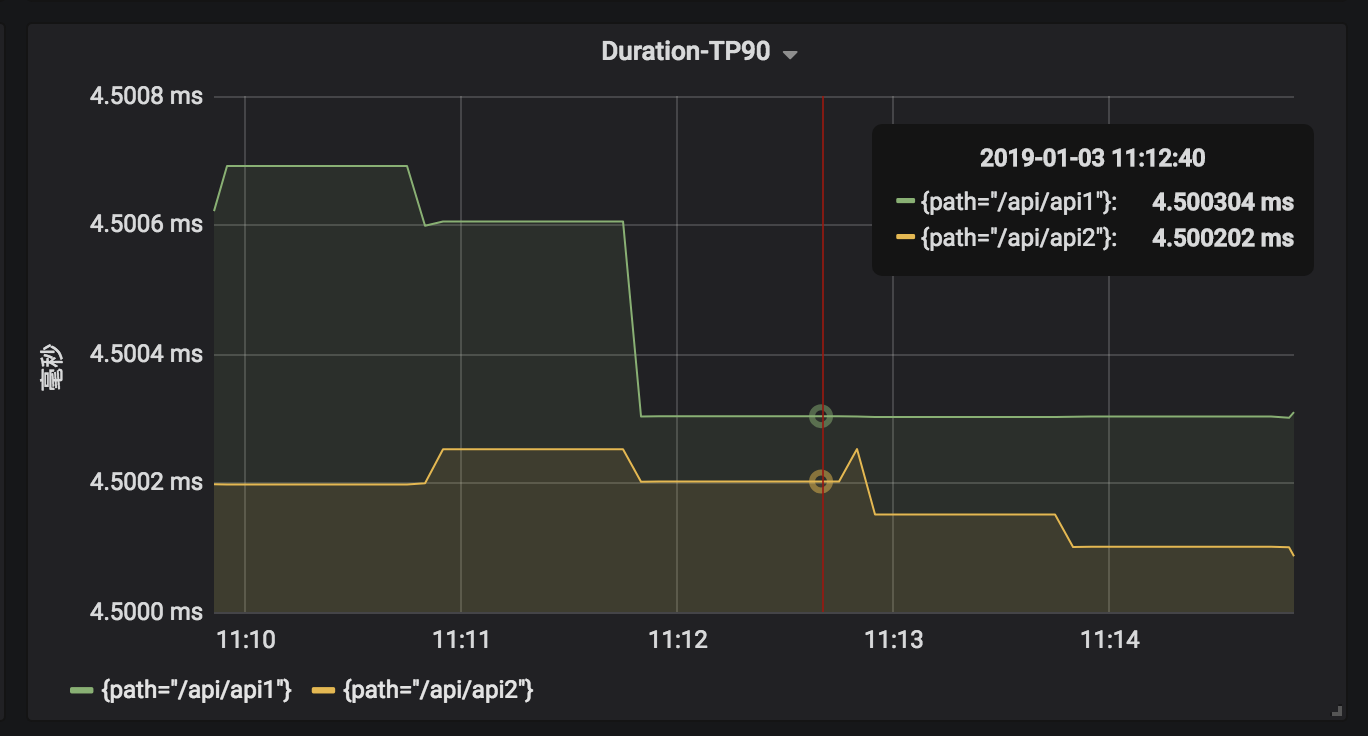
3.3 分接口-90分位请求耗时
Query:
histogram_quantile(0.9, sum(rate(http_request_duration_seconds_bucket{project="fake_service"}[5m])) by (path, le)) * 1000
参考资料

不错不错?
你好,文中的那个为什么是QPS,难道不是变化率吗??
对于请求数计数,求变化率,得到的变化率就是QPS
对于“3.3 分接口-90分位请求耗时”,这个PromQL里是不是漏了 by (path)?
是的,已改
怎么展示面板
如果是使用grafana的话,可以把prometheus设置为数据源,然后就可以配置面板了