OpenTelemetry原理及实战
版权声明 本站原创文章 由 萌叔 发表
转载请注明 萌叔 | https://vearne.cc
1. 简介
OpenTelemetry 是一个开源的可观测性框架,它提供了一系列工具、API 和 SDK,用于收集、处理和导出遥测数据,如追踪(traces)、指标(metrics)和日志(logs)。OpenTelemetry 的目标是提供一个与供应商无关的、跨平台的解决方案,以帮助开发者和运维人员监控和分析分布式系统的性能和行为。
1.1 OpenTelemetry的终极目标

OpenTelemetry的终极目标了:实现Metrics、Tracing、Logging的融合及大一统,作为APM的数据采集终极解决方案。
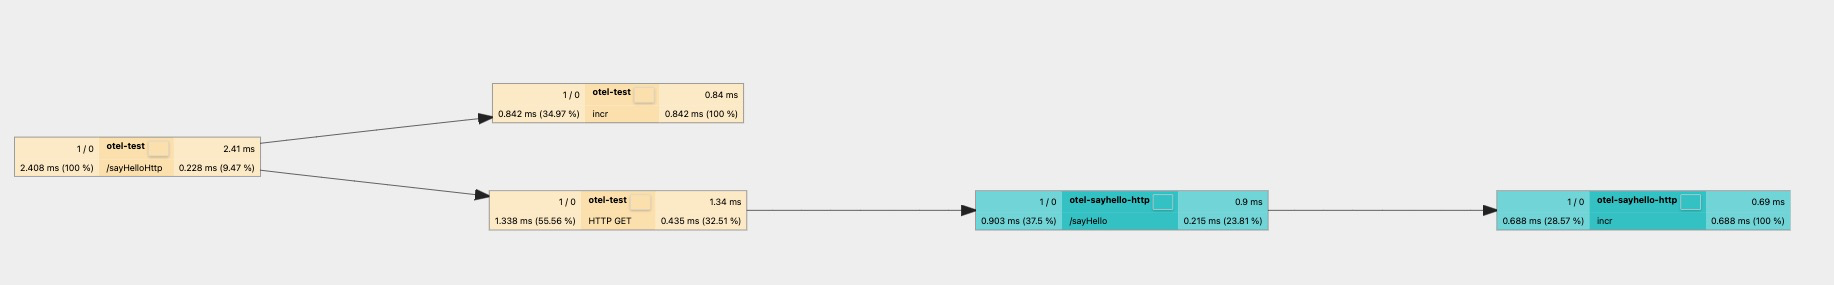
- Tracing:提供了一个请求从接收到处理完成整个生命周期的跟踪路径,一次请求通常过经过N个系统,因此也被称为分布式链路追踪
- Metrics:例如cpu、请求延迟、用户访问数等Counter、Gauge、Histogram指标
- Logging:传统的日志,提供精确的系统记录
三者的组合可以形成大一统的APM解决方案:
- 基于Metrics告警发现异常
- 通过Tracing定位到具体的系统和方法
- 根据模块的日志最终定位到错误详情和根源
1.2 核心工作
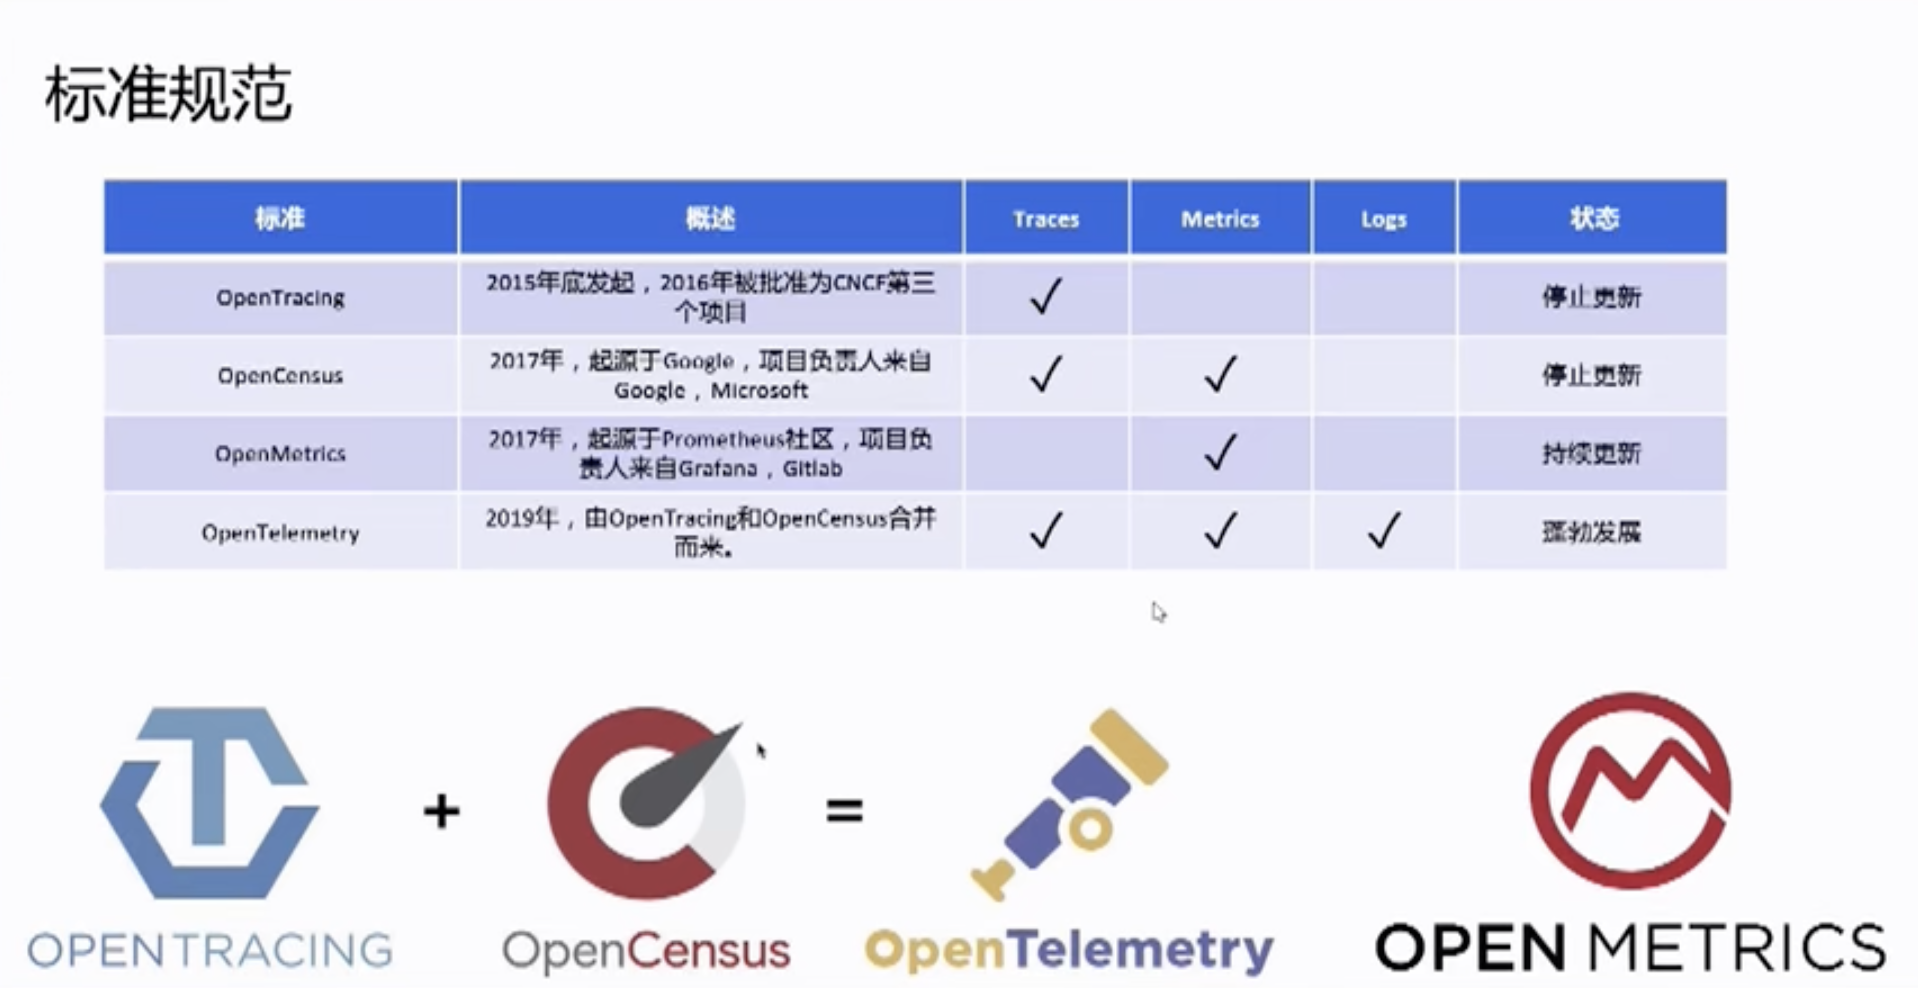
标准 + 通用实现
OpenTelemetry的核心工作目前主要集中在3个部分:
- 规范的制定和协议的统一,规范包含数据传输、API的规范,协议的统一包含:HTTP W3C的标准支持及GRPC等框架的协议标准
-
多语言SDK的实现和集成,用户可以使用SDK进行代码自动注入和手动埋点,同时对其他三方库(Log4j、LogBack等)进行集成支持;
-
数据收集系统的实现,当前是基于OpenCensus Service的收集系统,包括Agent和Collector。
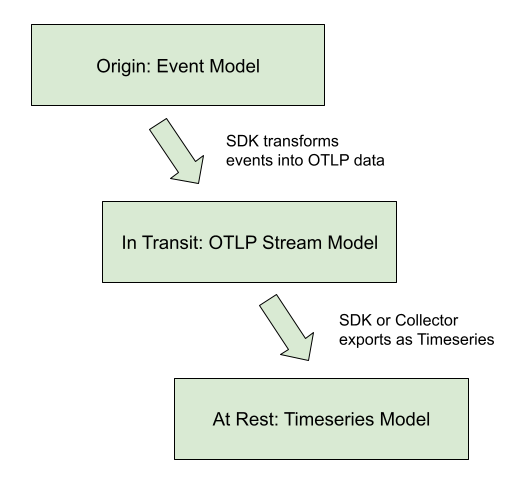
1.3 数据模型
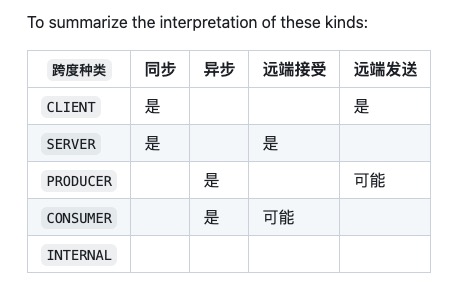
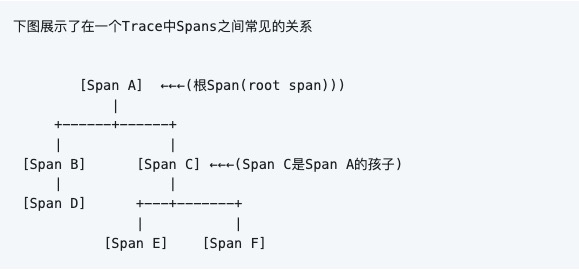
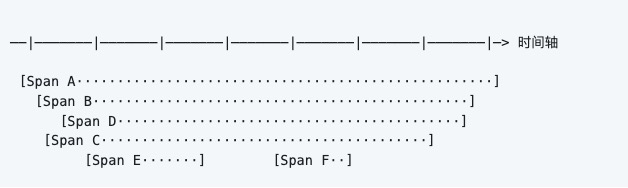
1.3.1 Span
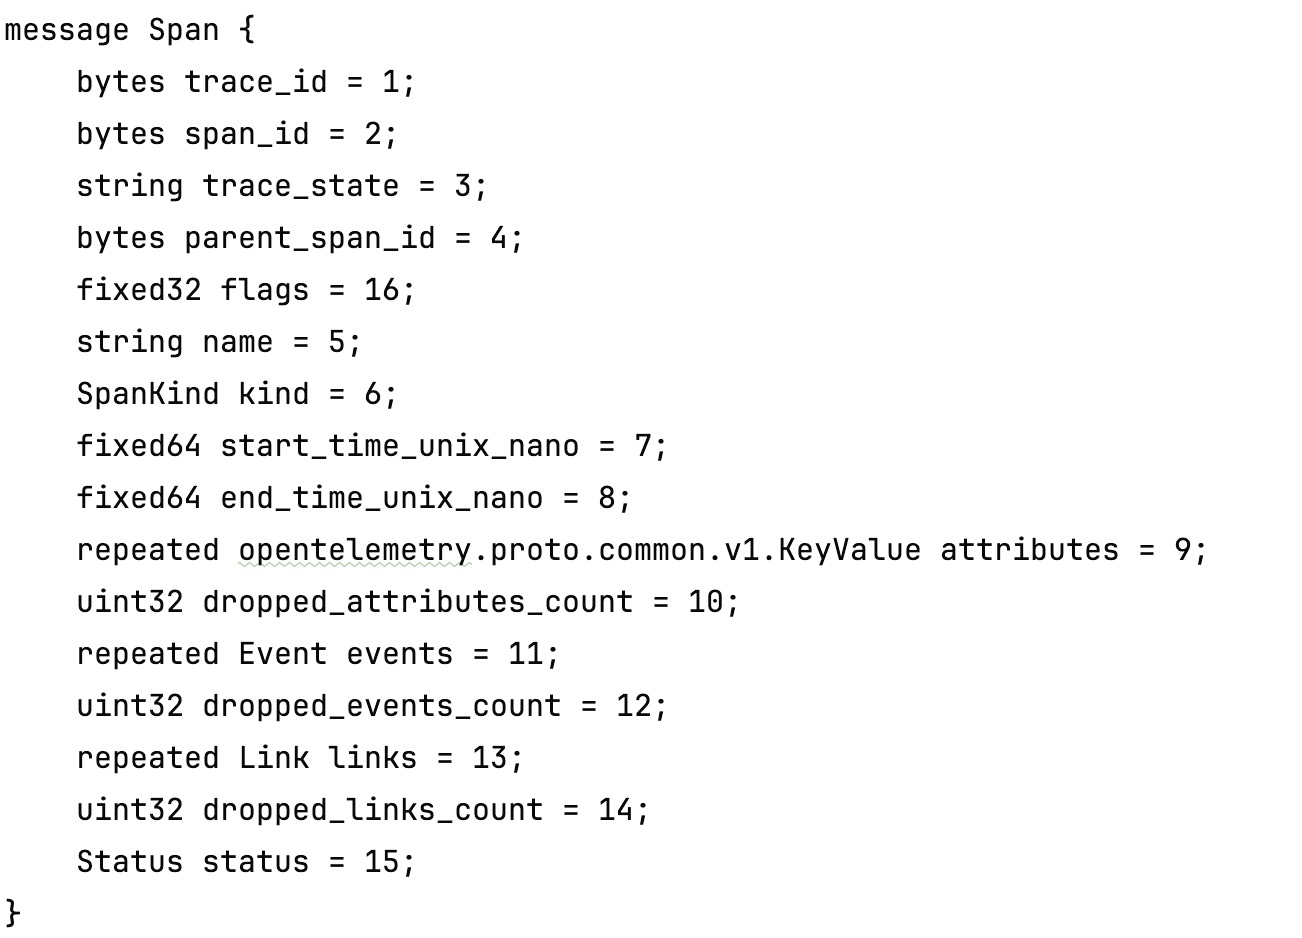
SpanKind
Status只有3种状态
    // The default status.
    STATUS_CODE_UNSET               = 0;
    // The Span has been validated by an Application developer or Operator to
    // have completed successfully.
    STATUS_CODE_OK                  = 1;
    // The Span contains an error.
    STATUS_CODE_ERROR               = 2;
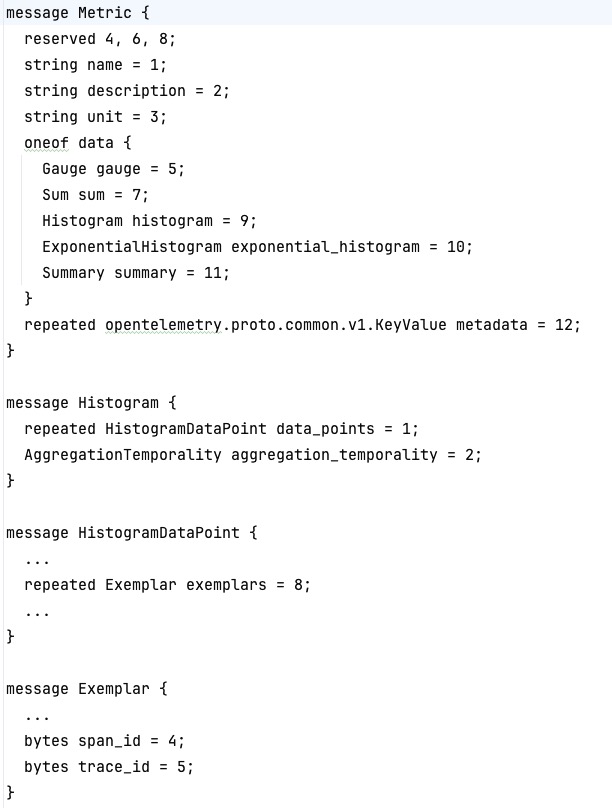
1.3.2 Metrics
1.4 Trace Context 传播
1.4.1 服务内部(包含跨协程传递)传播
r.GET("/ping", func(c *gin.Context) {
        ctx := c.Request.Context()
        g, _ := errgroup.WithContext(ctx)

        g.Go(func() error {
            val, err := rdb.Incr(ctx, "helloCounter2").Result()
            if err != nil {
                zlog.ErrorContext(ctx, "ping", zap.Int64("val", val), zap.Error(err))
            } else {
                zlog.InfoContext(ctx, "ping", zap.Int64("val", val))
            }
            return nil
        })
      ...
        g.Wait()
        c.JSON(http.StatusOK, gin.H{
            "message": "pong",
        })
    })
1.4.2 跨服务传播
某个gRPC header头信息
user-agent: grpc-go/1.62.0
traceparent: 00-db66dc7d1bff34d600a905d1b0084b05-dcc18a78029436c7-01
baggage:mykey=myvalue
:authority: localhost:50051
content-type: application/grpc
grpc-accept-encoding: gzip
baggage:mykey=myvalue
在OpenTelemetry中,Baggage 是一种用于在分布式系统中传递数据的机制,而上游服务可以在请求中设置 Baggage,下游服务则可以读取这些信息。Baggage 允许您传递键值对,这些键值对随着请求的传递而在不同的服务之间流动。
Baggage可以用来传输租户信息、用户IP、用户画像等信息
注意: 在OpenTelemetry中,无论上游服务是否对某个trace进行采样,traceContext都会随着请求在上下游间传递。
只是此时traceparent的值可能为
traceparent: 00-c30f50e3c4783475c22dd8599d353af1-c439afb046ec46da-00
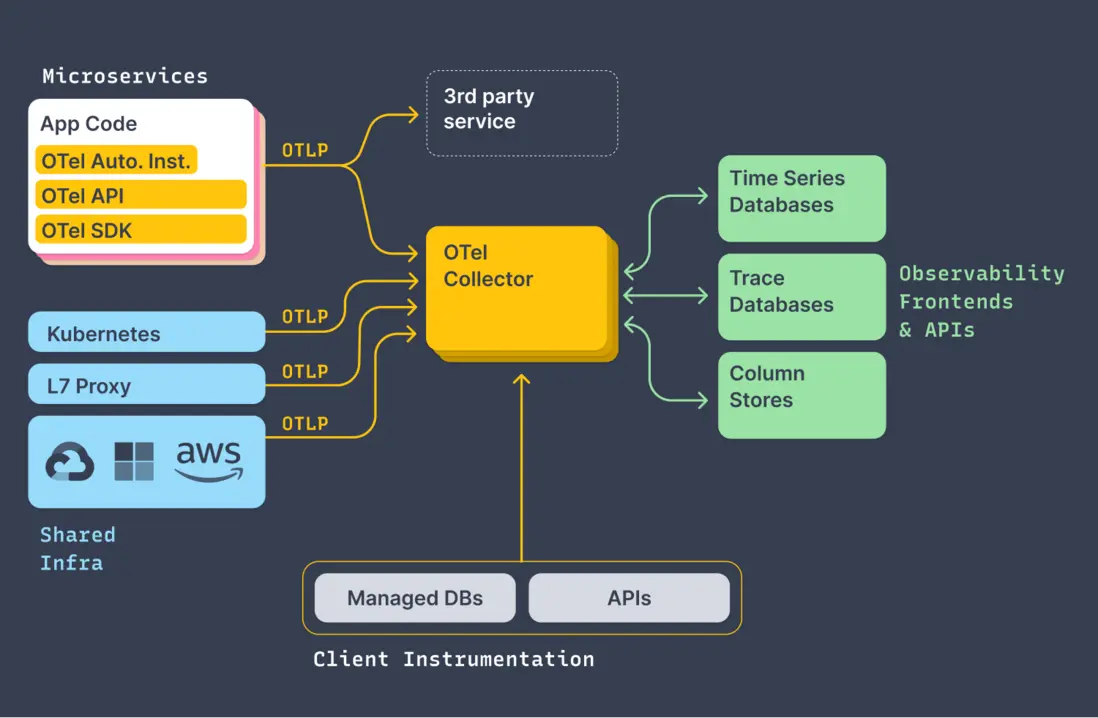
2. 数据流

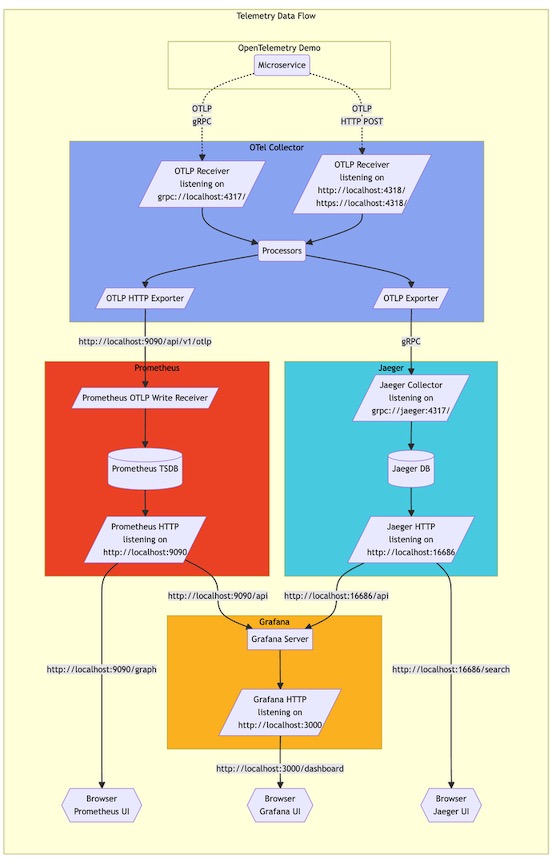
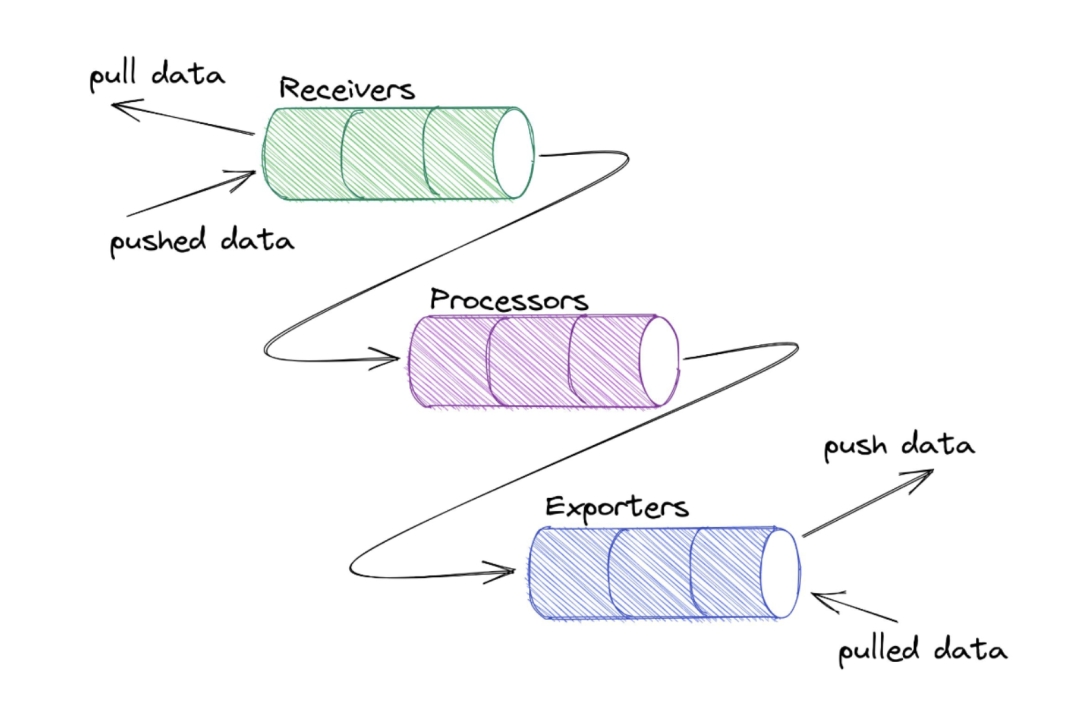
2.1 Collector
在Linux和Unix系统中,Shell命令设计思想的一个重要概念是"每个命令都是一个filter",这体现了Unix哲学的一部分。这种思想强调将简单的工具组合在一起,每个工具专注于完成一项特定的任务。
$ cat test.sh | grep -n 'echo'
otelcol-config.yml
receivers:
  otlp:
    protocols:
      grpc:
      http:
        cors:
          allowed_origins:
            - "http://*"
            - "https://*"
              #  httpcheck/frontendproxy:
              #targets:
            #- endpoint: http://frontendproxy:${env:ENVOY_PORT}

exporters:
  debug:
  otlp:
    endpoint: "jaeger:4317"
    tls:
      insecure: true
  otlphttp/prometheus:
    endpoint: "http://prometheus:9090/api/v1/otlp"
    tls:
      insecure: true
  opensearch:
    logs_index: otel
    http:
      endpoint: "http://opensearch:9200"
      tls:
        insecure: true
  prometheus:
    endpoint: "otelcol:11234"

processors:
  batch:

connectors:
  spanmetrics:

service:
  pipelines:
    traces:
      receivers: [otlp]
      processors: [batch]
      exporters: [otlp, debug, spanmetrics]
    metrics:
      receivers: [otlp, spanmetrics]
      processors: [batch]
      exporters: [otlphttp/prometheus, debug, prometheus]
    logs:
      receivers: [otlp]
      processors: [batch]
      exporters: [opensearch, debug]

Collector级联

此处的Load Balancer也是Collector,参考Collector-deployment
receivers:
  otlp:
    protocols:
      grpc:
        endpoint: 0.0.0.0:4317

exporters:
  loadbalancing:
    routing_key: "traceID"
    protocol:
      otlp:
        tls:
          insecure: true
    resolver:
      static:
        hostnames:
          - collector-1.example.com:4317
          - collector-2.example.com:5317
          - collector-3.example.com

service:
  pipelines:
    traces:
      receivers: [otlp]
      exporters: [loadbalancing]
2.2 采样
-
90%链路数据采集意义不大
-
哪些是应该全量采集的链路?
三种优先级高场景:
A、在调用链上打印过 ERROR 级别日志
B、在调用链上出现过大于 200ms 的数据库查询
C、整个调用链请求耗时超过 1s
关心的调用链,从日志级别、响应时间、核心组件的性能指标(这里举例数据库)几个维度入手
按照决策发生的时间
- 头部采样
- 尾部采样(服务端)
按照采样策略划分
• 百分比采样:主要用在链路最开始节点
• 固定阈值采样:全局或租户内统一控制
• 限速采样:在入口处按固定频率采样若干条调用链;
• 异常优先采样:调用出错时优先采样;
• 个性化采样:按用户ID、入口IP、应用、调用链入口、业务标识等配置开启采样
OpenTelmetry同时支持客户端采样和服务端采样
3. 实战
3.1 日志文件中携带trace_id
2024-03-05 09:59:15 | info | say_hello_grpc/main.go:97 | test hello | {"val": 146, "trace_id": "e1b57619d667f1f7db754e30e41c6a85"}
3.2 通过trace来查看日志
参考资料
2.logs数据模型
3.proto
4.可观测性技术生态和 OpenTelemetry 原理及实践
5.OpenTelemetry Demo Documentation
7.尾部采样处理器
8.Observability:深度聊聊采样 Sampling场景和落地案例-上篇
9.Observability之聊聊采样sampling场景和落地案例-下篇